Case study 04 / 06
Field: waveform
Data sonification
Undertone
Making a river’s sensor data audible for the night shift
- Client
- Waterschap Lage Delta
- Year
- 2024
- Role
- Product design, sound mapping, front-end
- Team
- Noor Haddad — design, sound mapping and front-end
- Dr. Femke Oudshoorn — hydrology, Lage Delta
- Jules Amrani — audio engineering
- Lage Delta control-room operators — testing and tuning
The brief
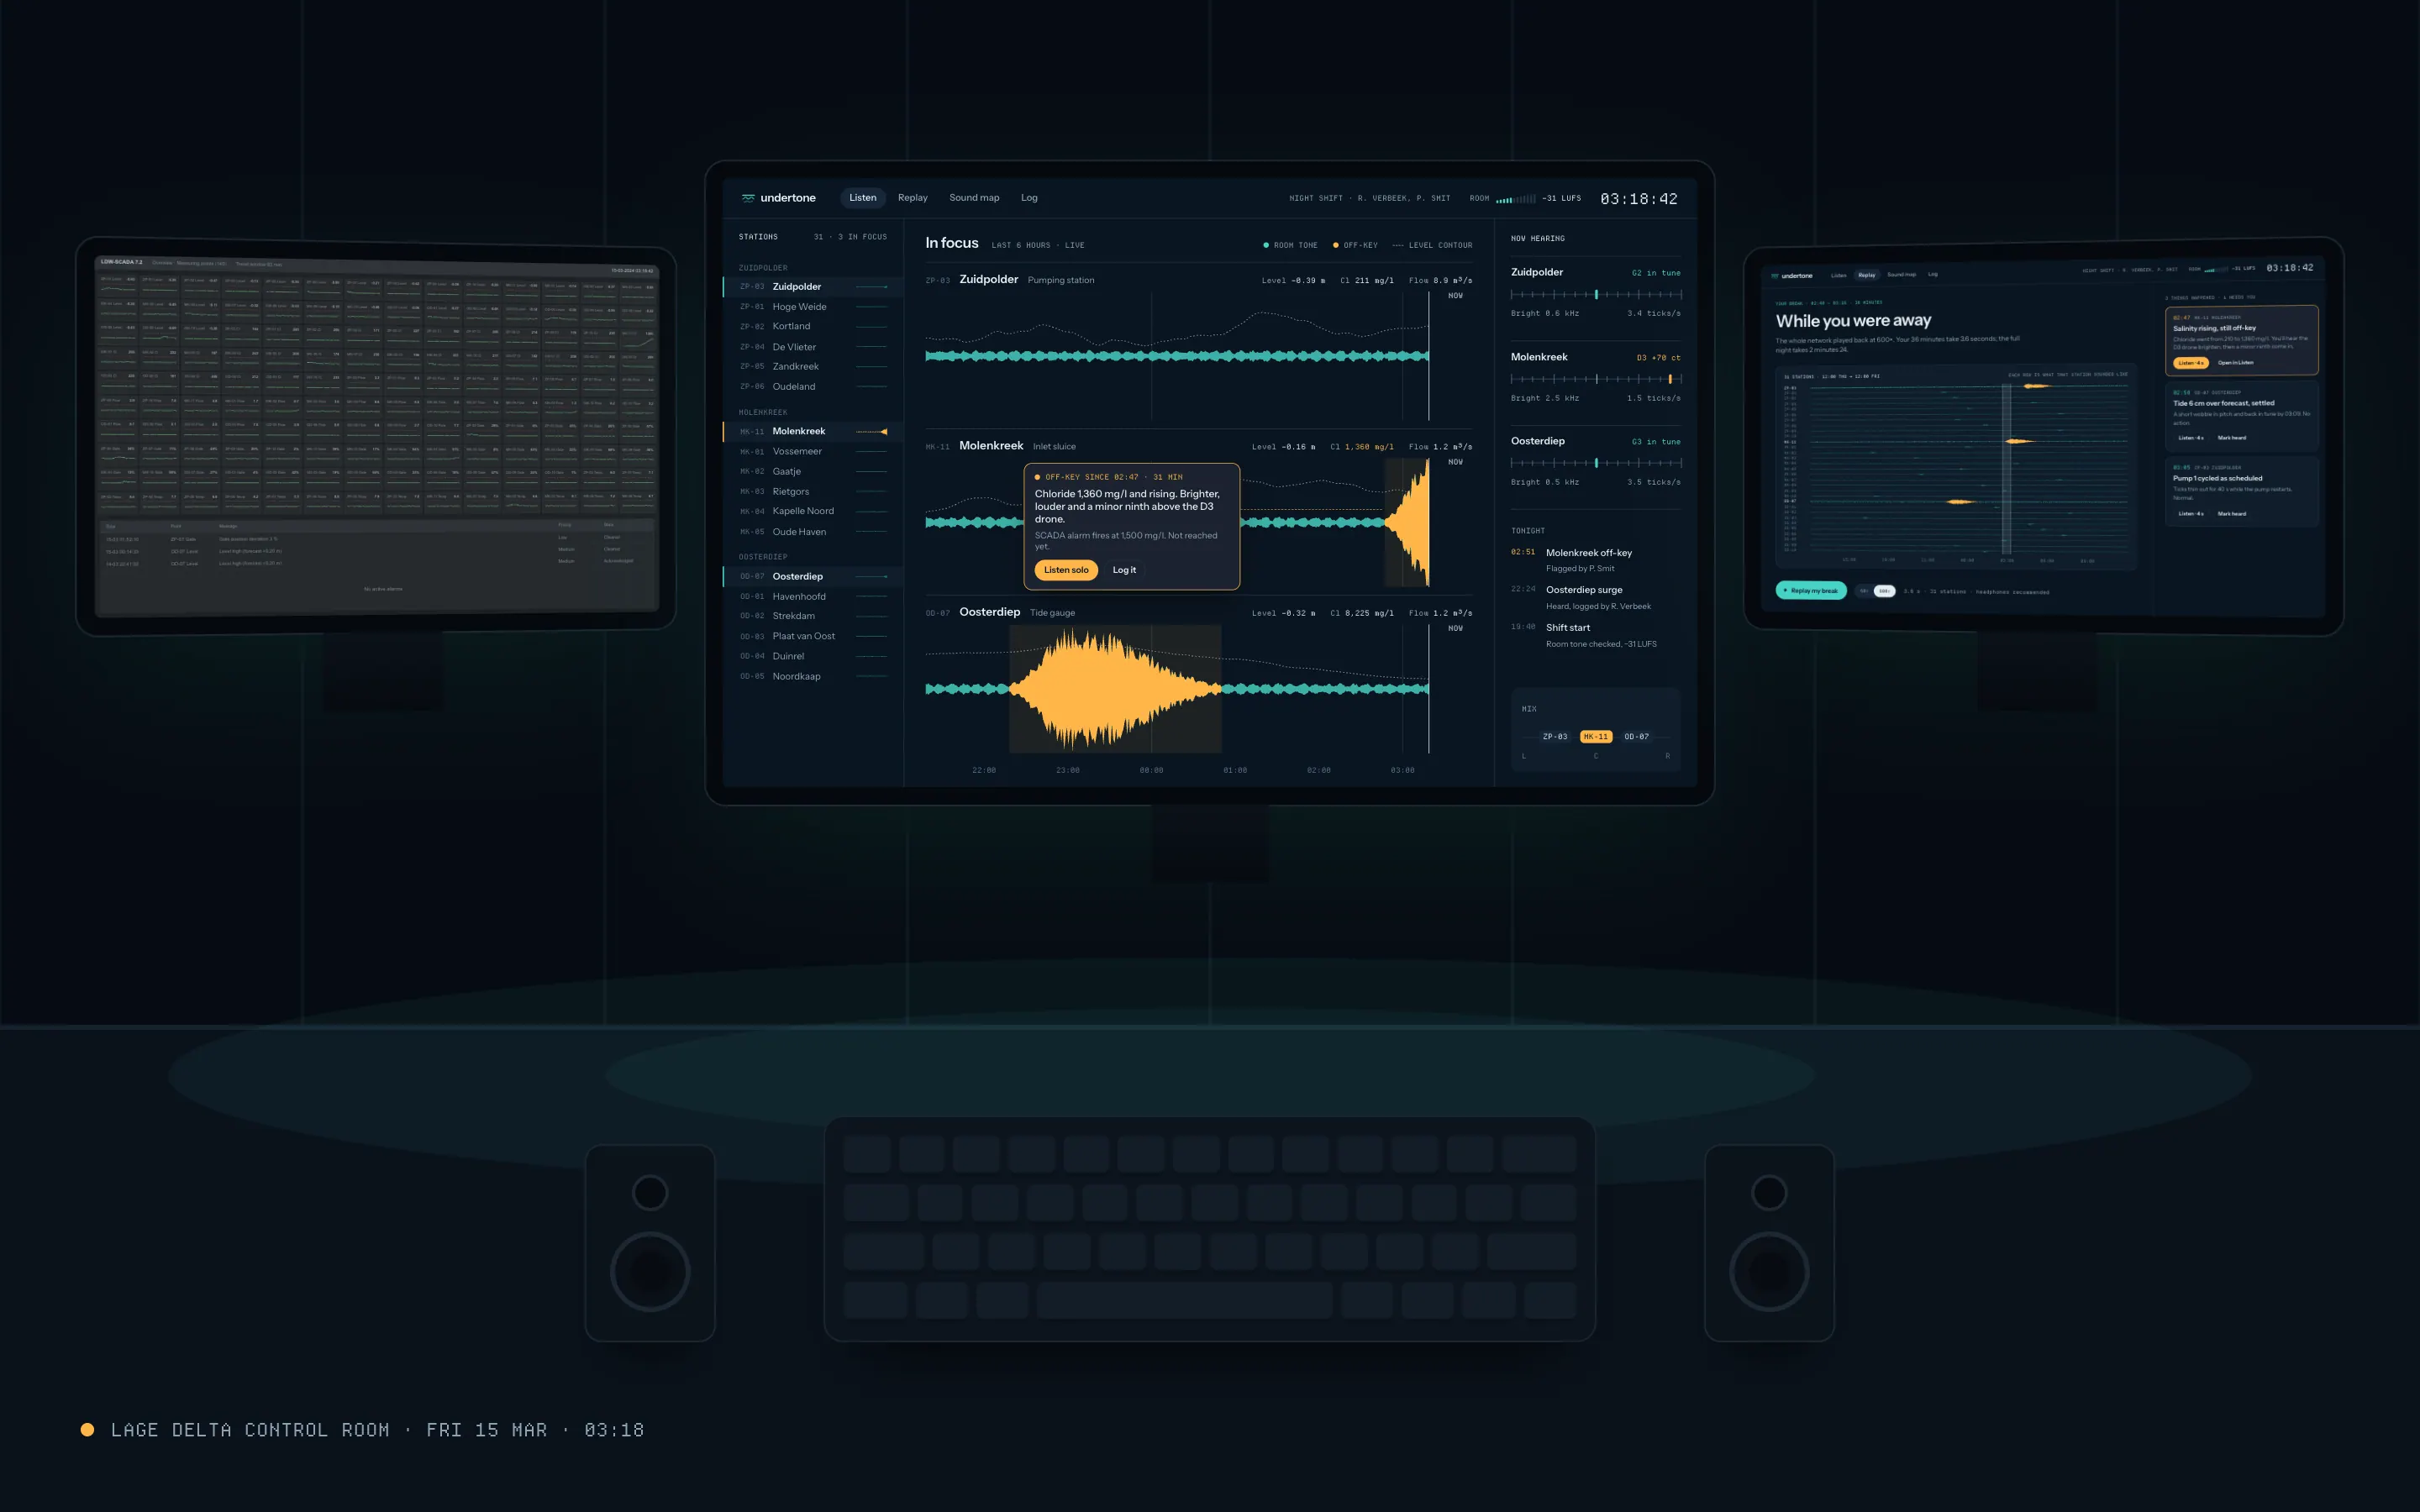
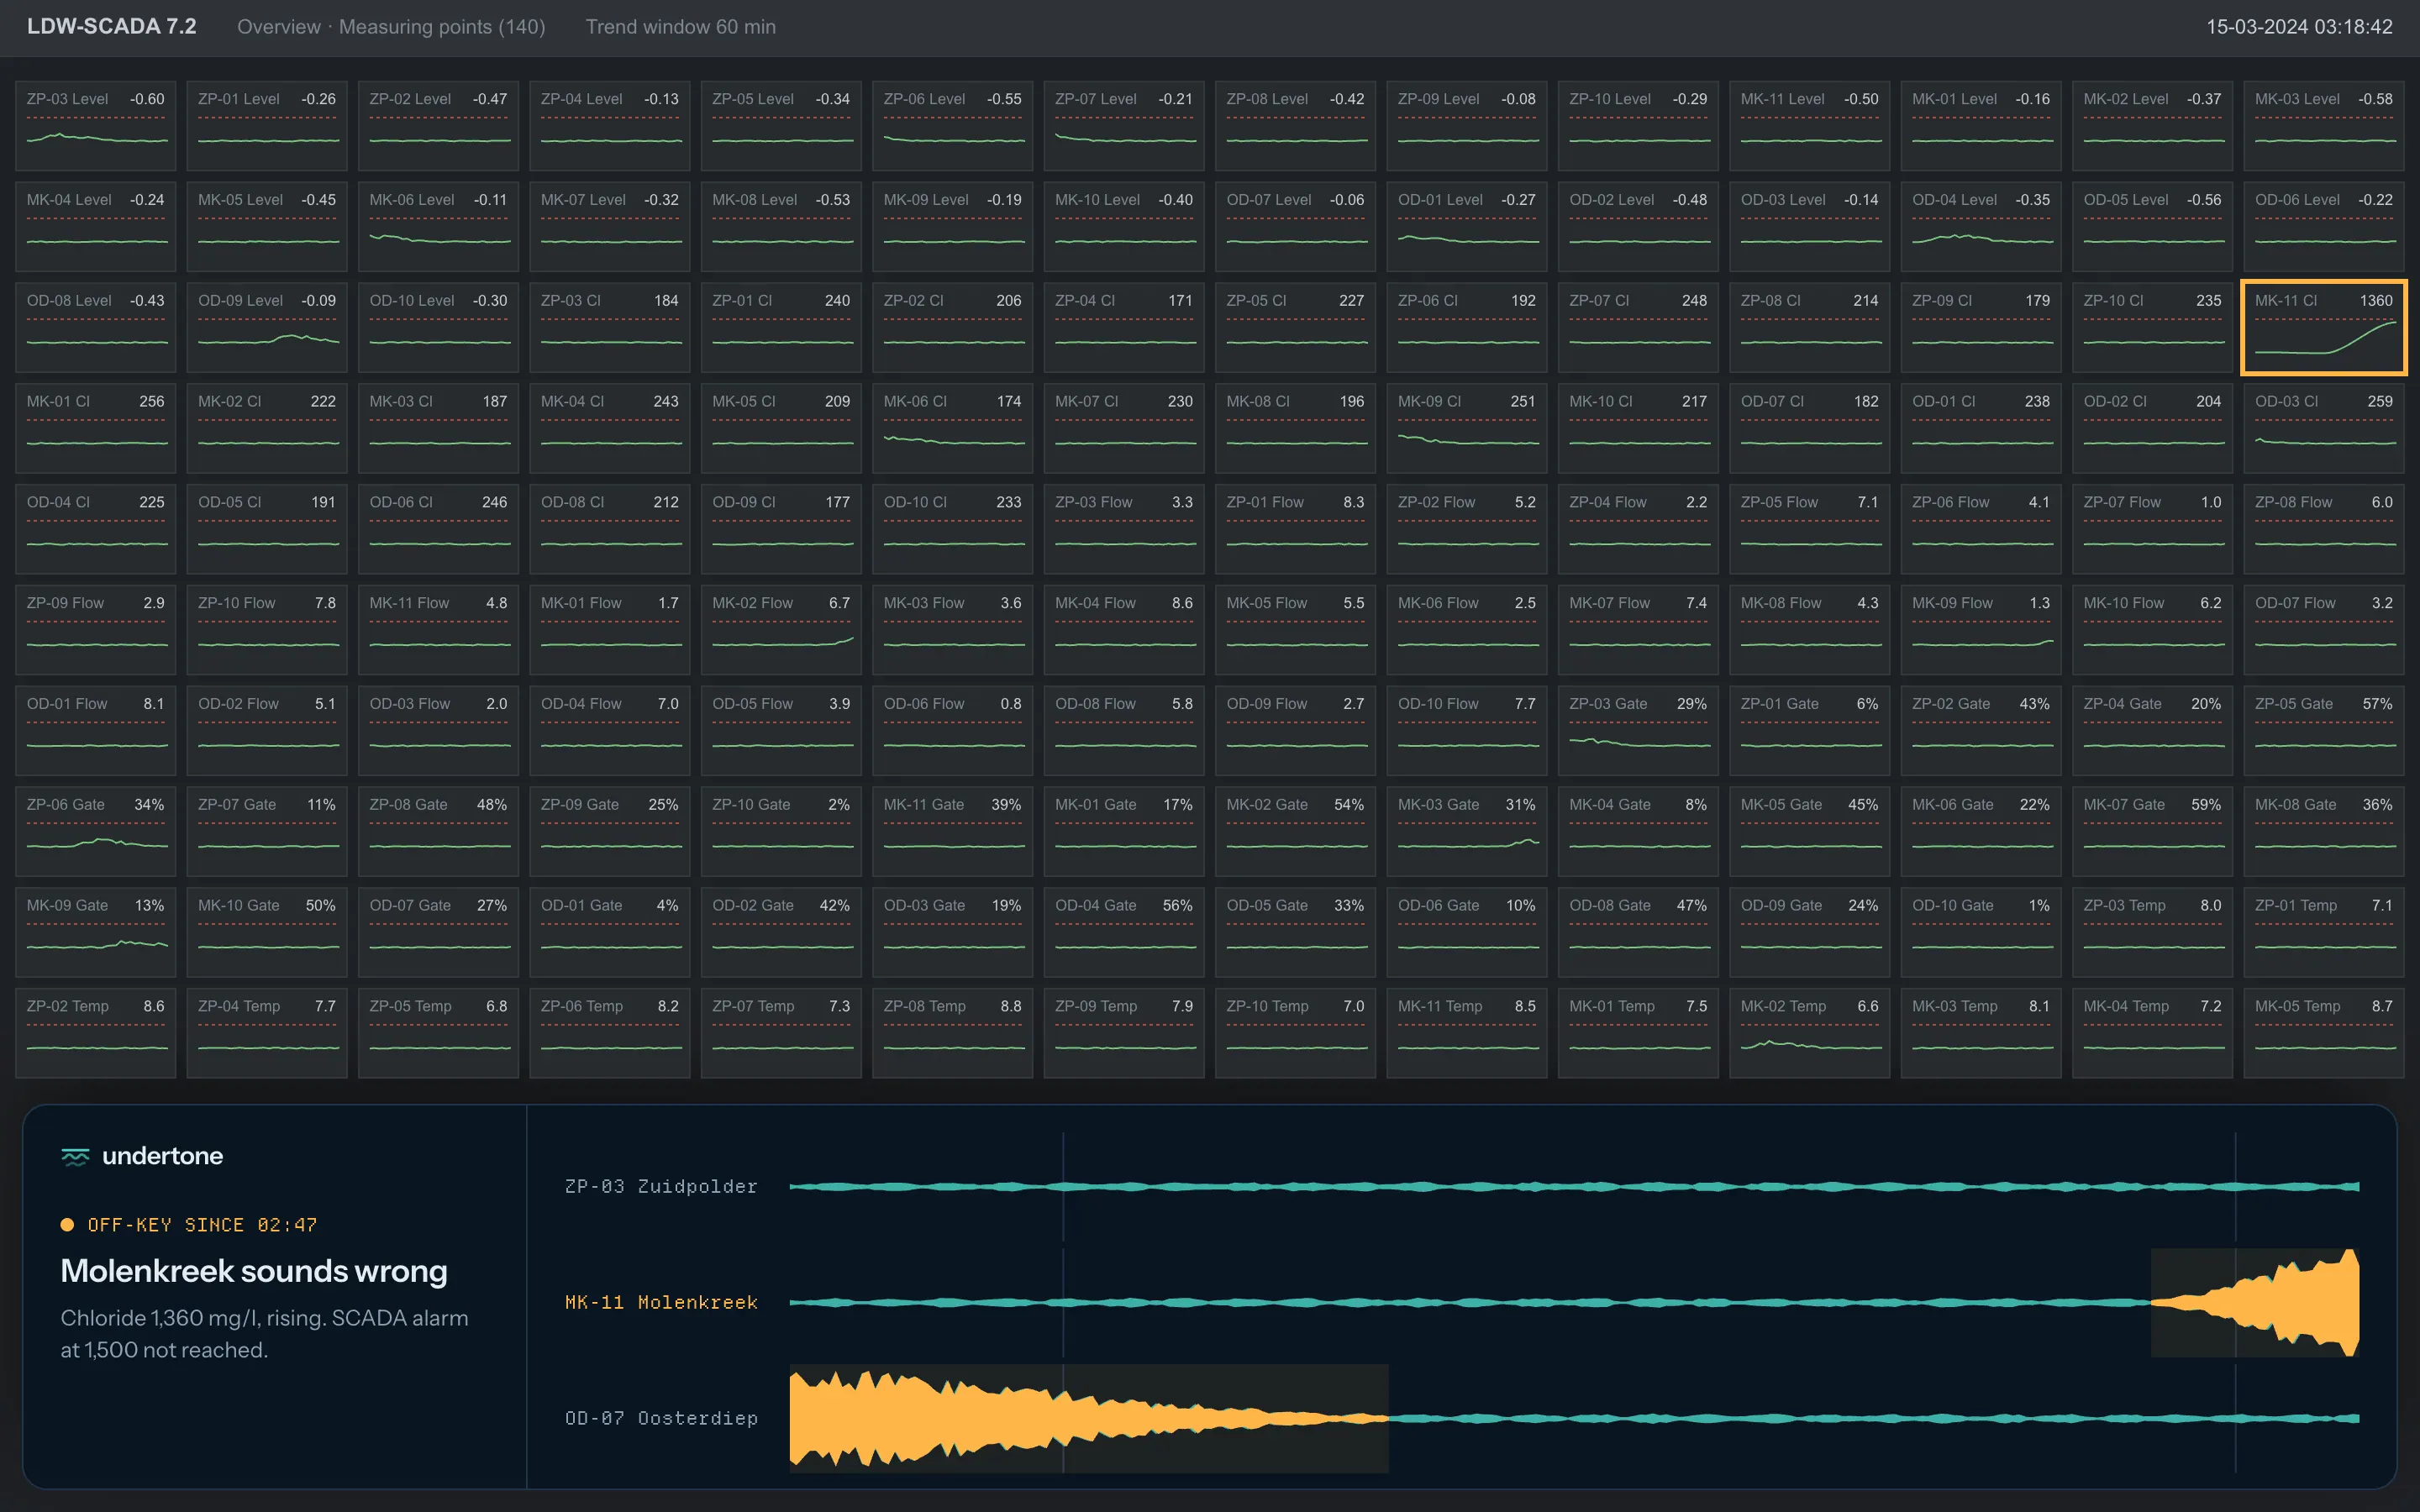
Lage Delta’s control room watches 31 stations through the night: about 140 sensor graphs across six screens. The thing it most needs to catch, salt water pushing up an inlet, starts as a slow bend in a chloride line that looks flat at three in the morning. By the time it crosses the SCADA threshold, the inlet has been taking in brackish water for half an hour.
Femke Oudshoorn, the board’s hydrologist, asked whether operators could hear the network instead of staring at it. The constraints were strict. No alarms or loud sounds: the room is shared and its rules forbid them. Nothing that replaces or touches the SCADA system. And a sound vocabulary that works for operators who have never played an instrument.
Decisions
- 01
Timbre families, not melodies
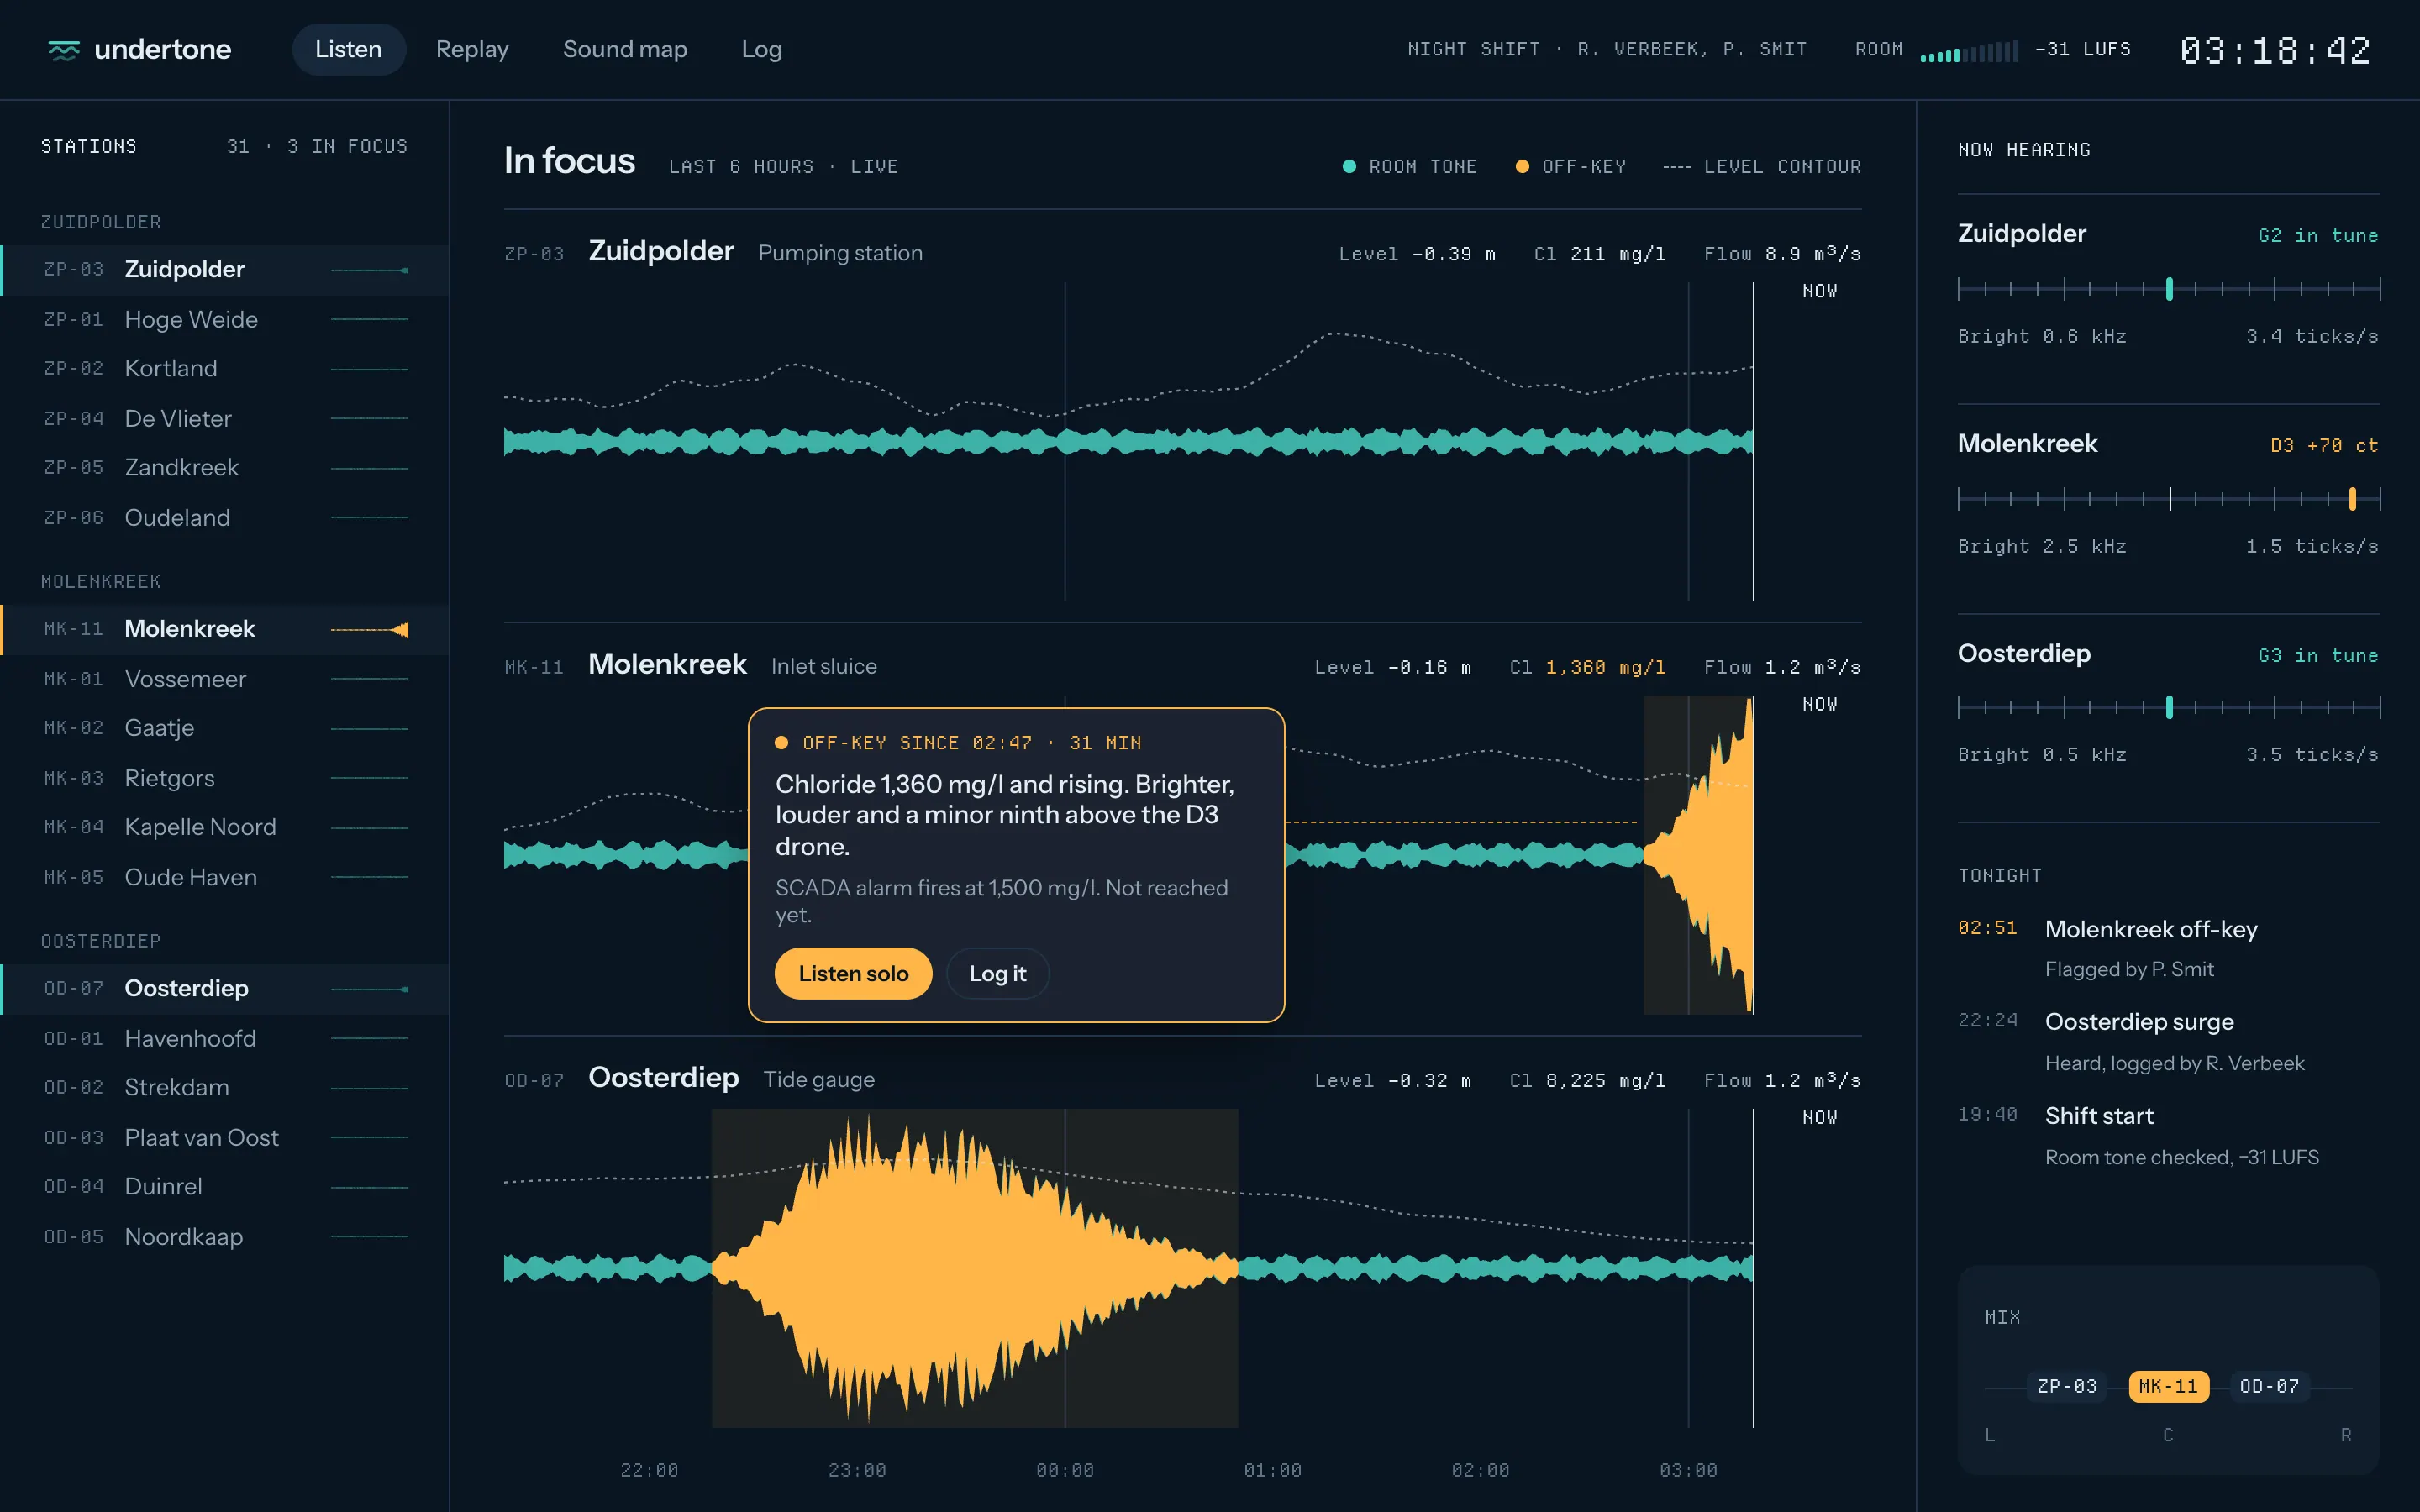
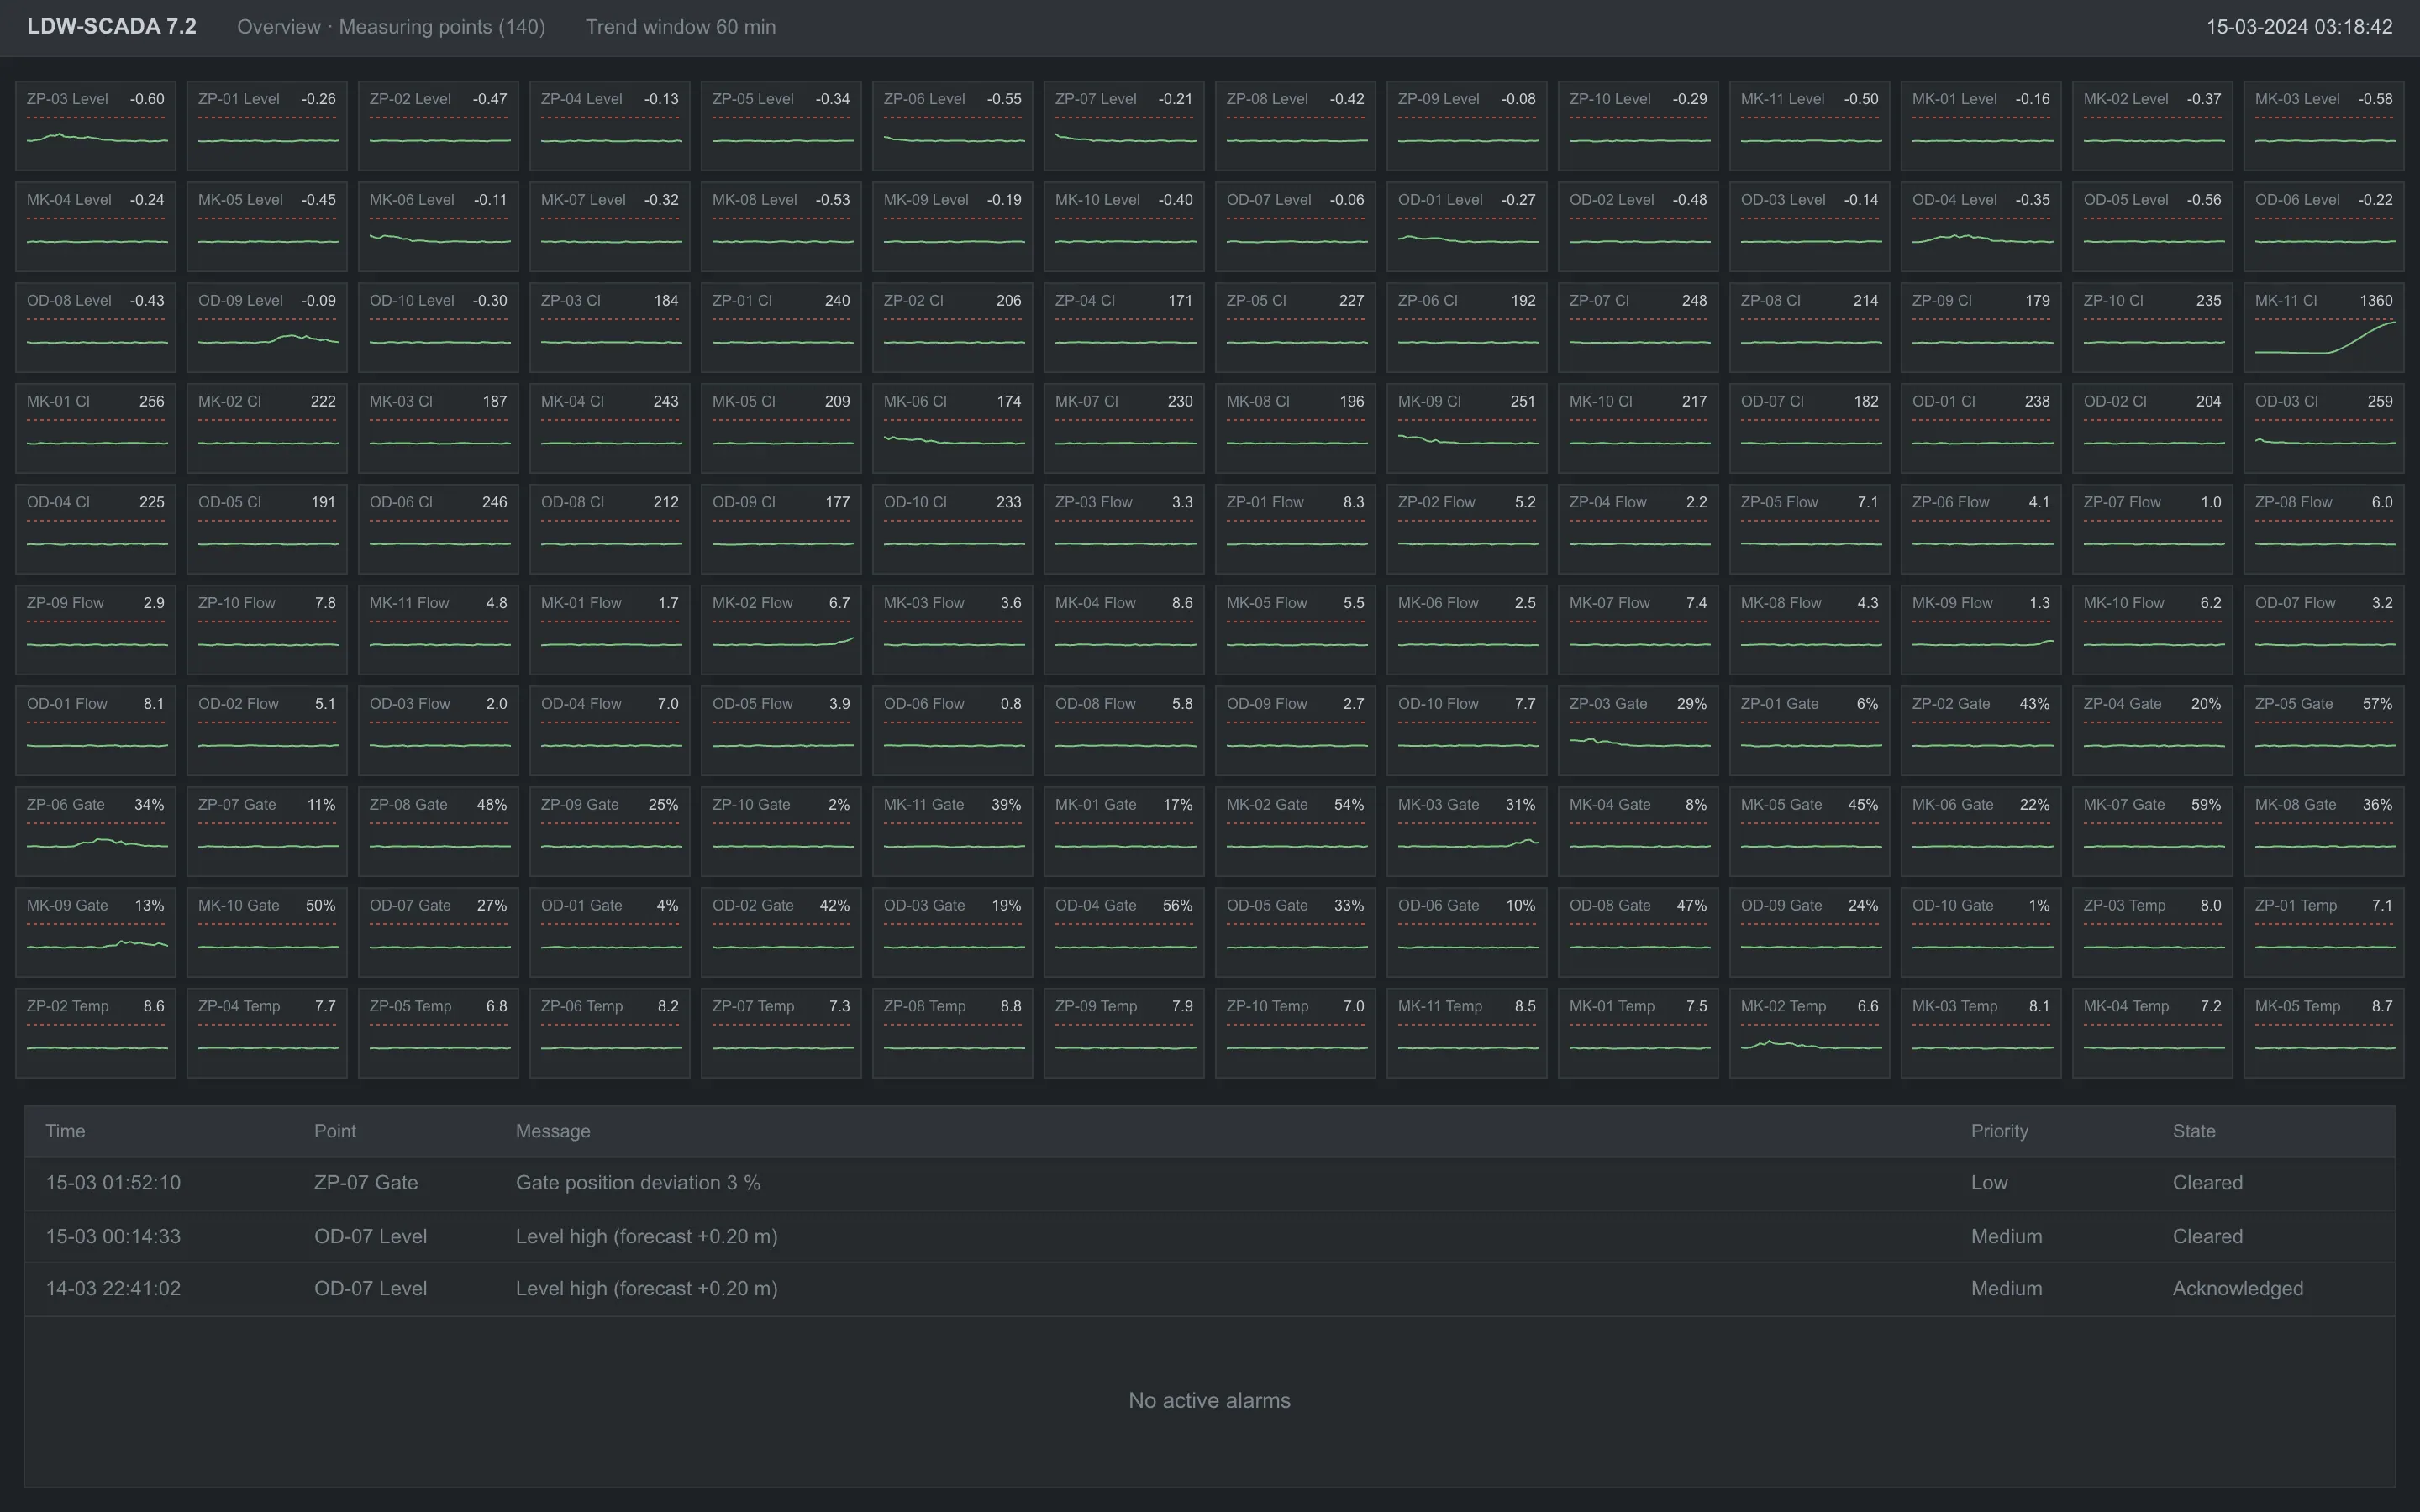
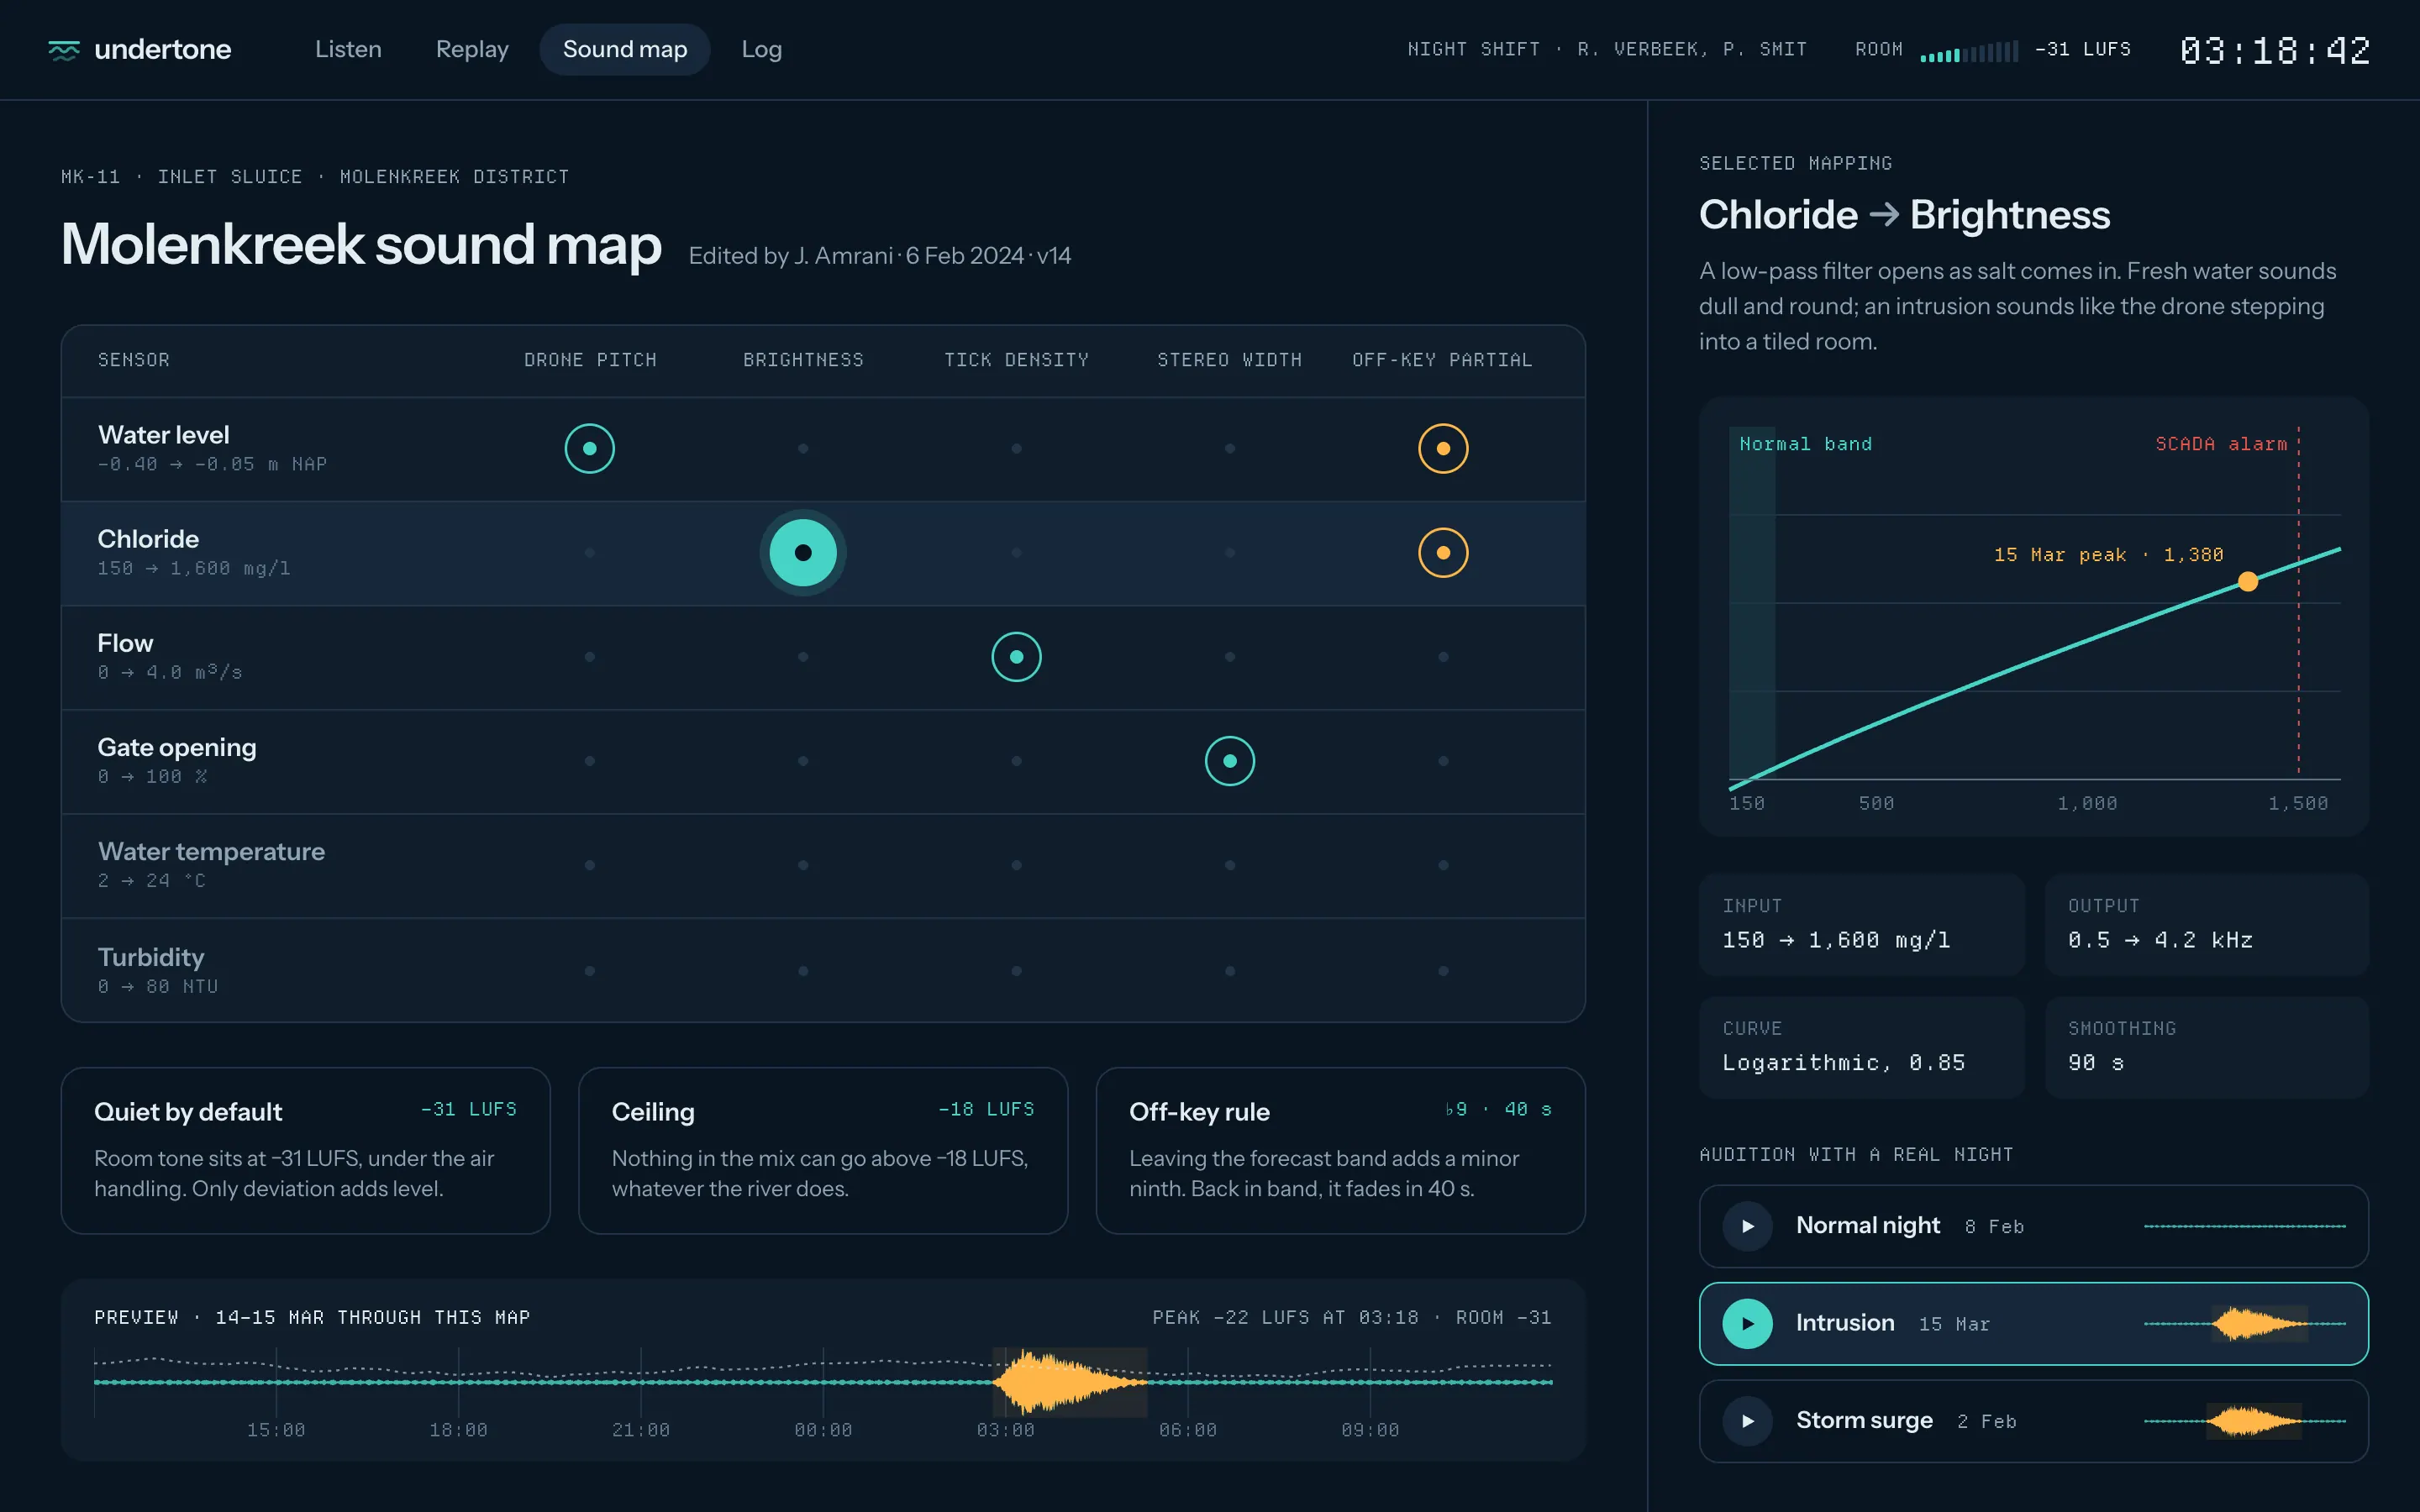
Each station is one soft drone. Water level sets its pitch, chloride opens a filter so it gets brighter, and flow sets the density of a layer of quiet ticks. Normal stations sit in a consonant chord. A station that leaves its forecast band drifts sharp and picks up a minor ninth, so an anomaly is heard as something going out of tune rather than as an alarm.
- 02
Quiet by default
Room tone sits around −30 LUFS, under the air handling. Level is only added for deviation, and nothing in the mix can go above −18 LUFS. On a normal night it is a hum you stop noticing, which is exactly what makes a change stand out.
- 03
Scrub and replay
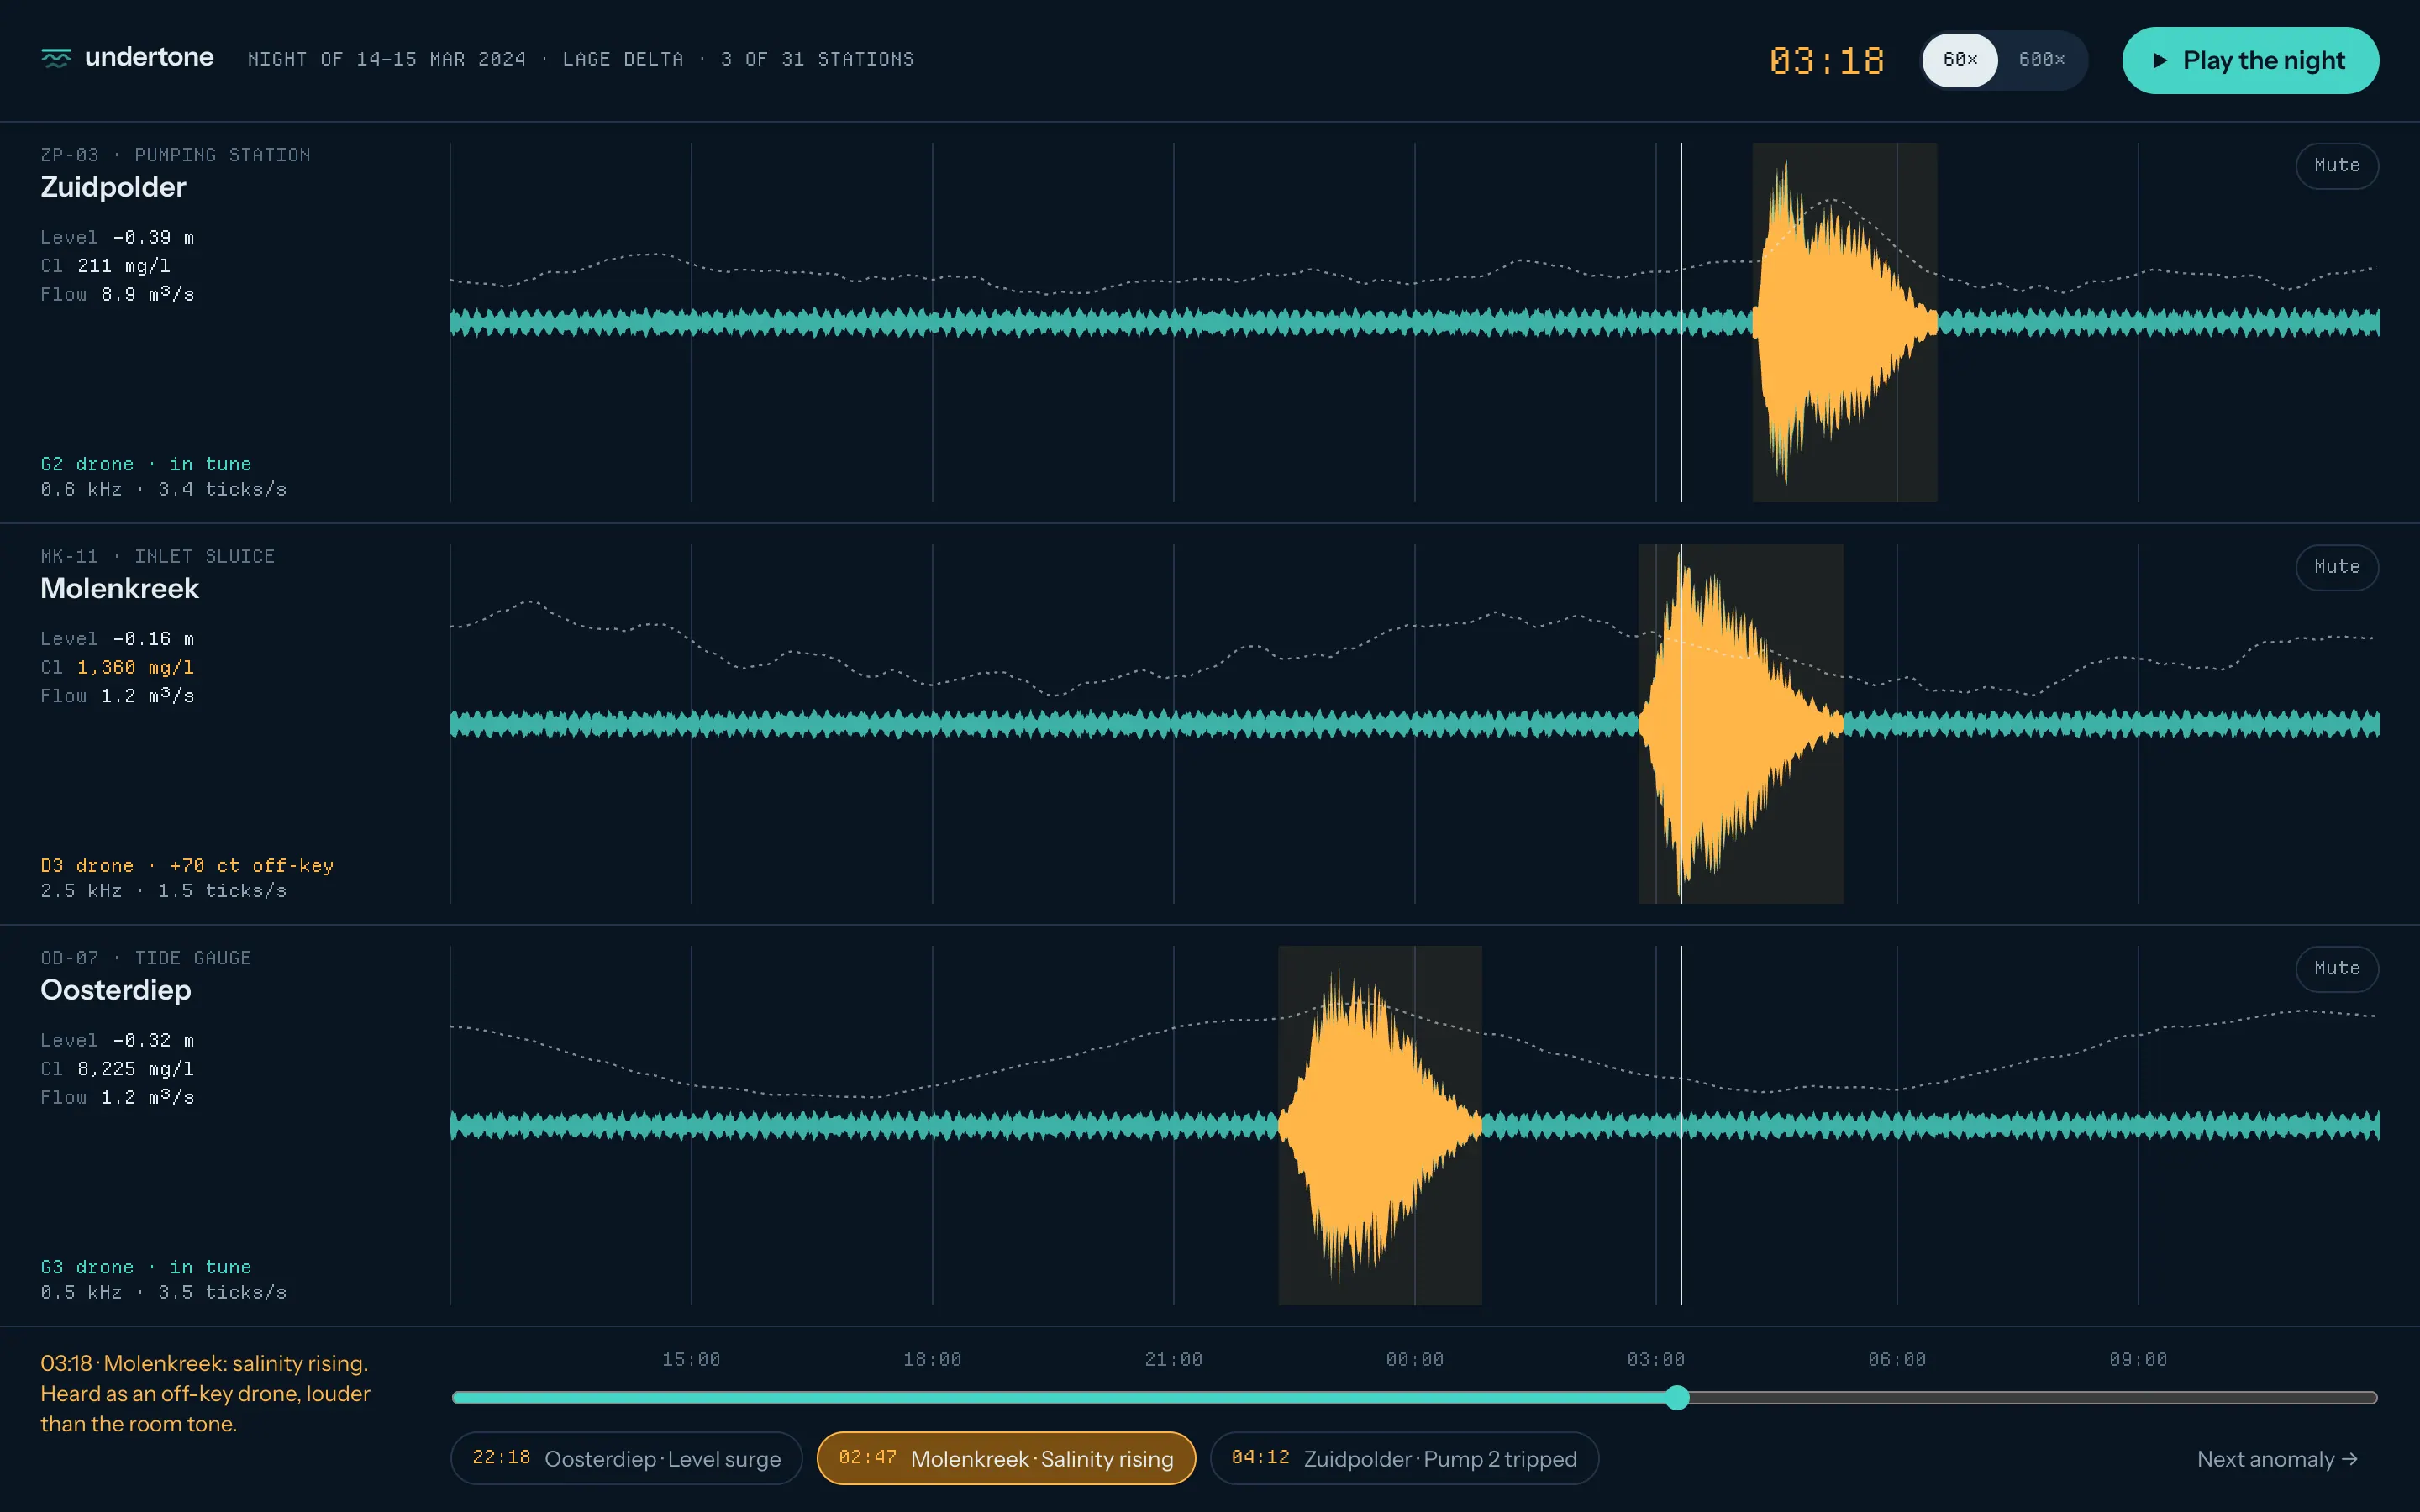
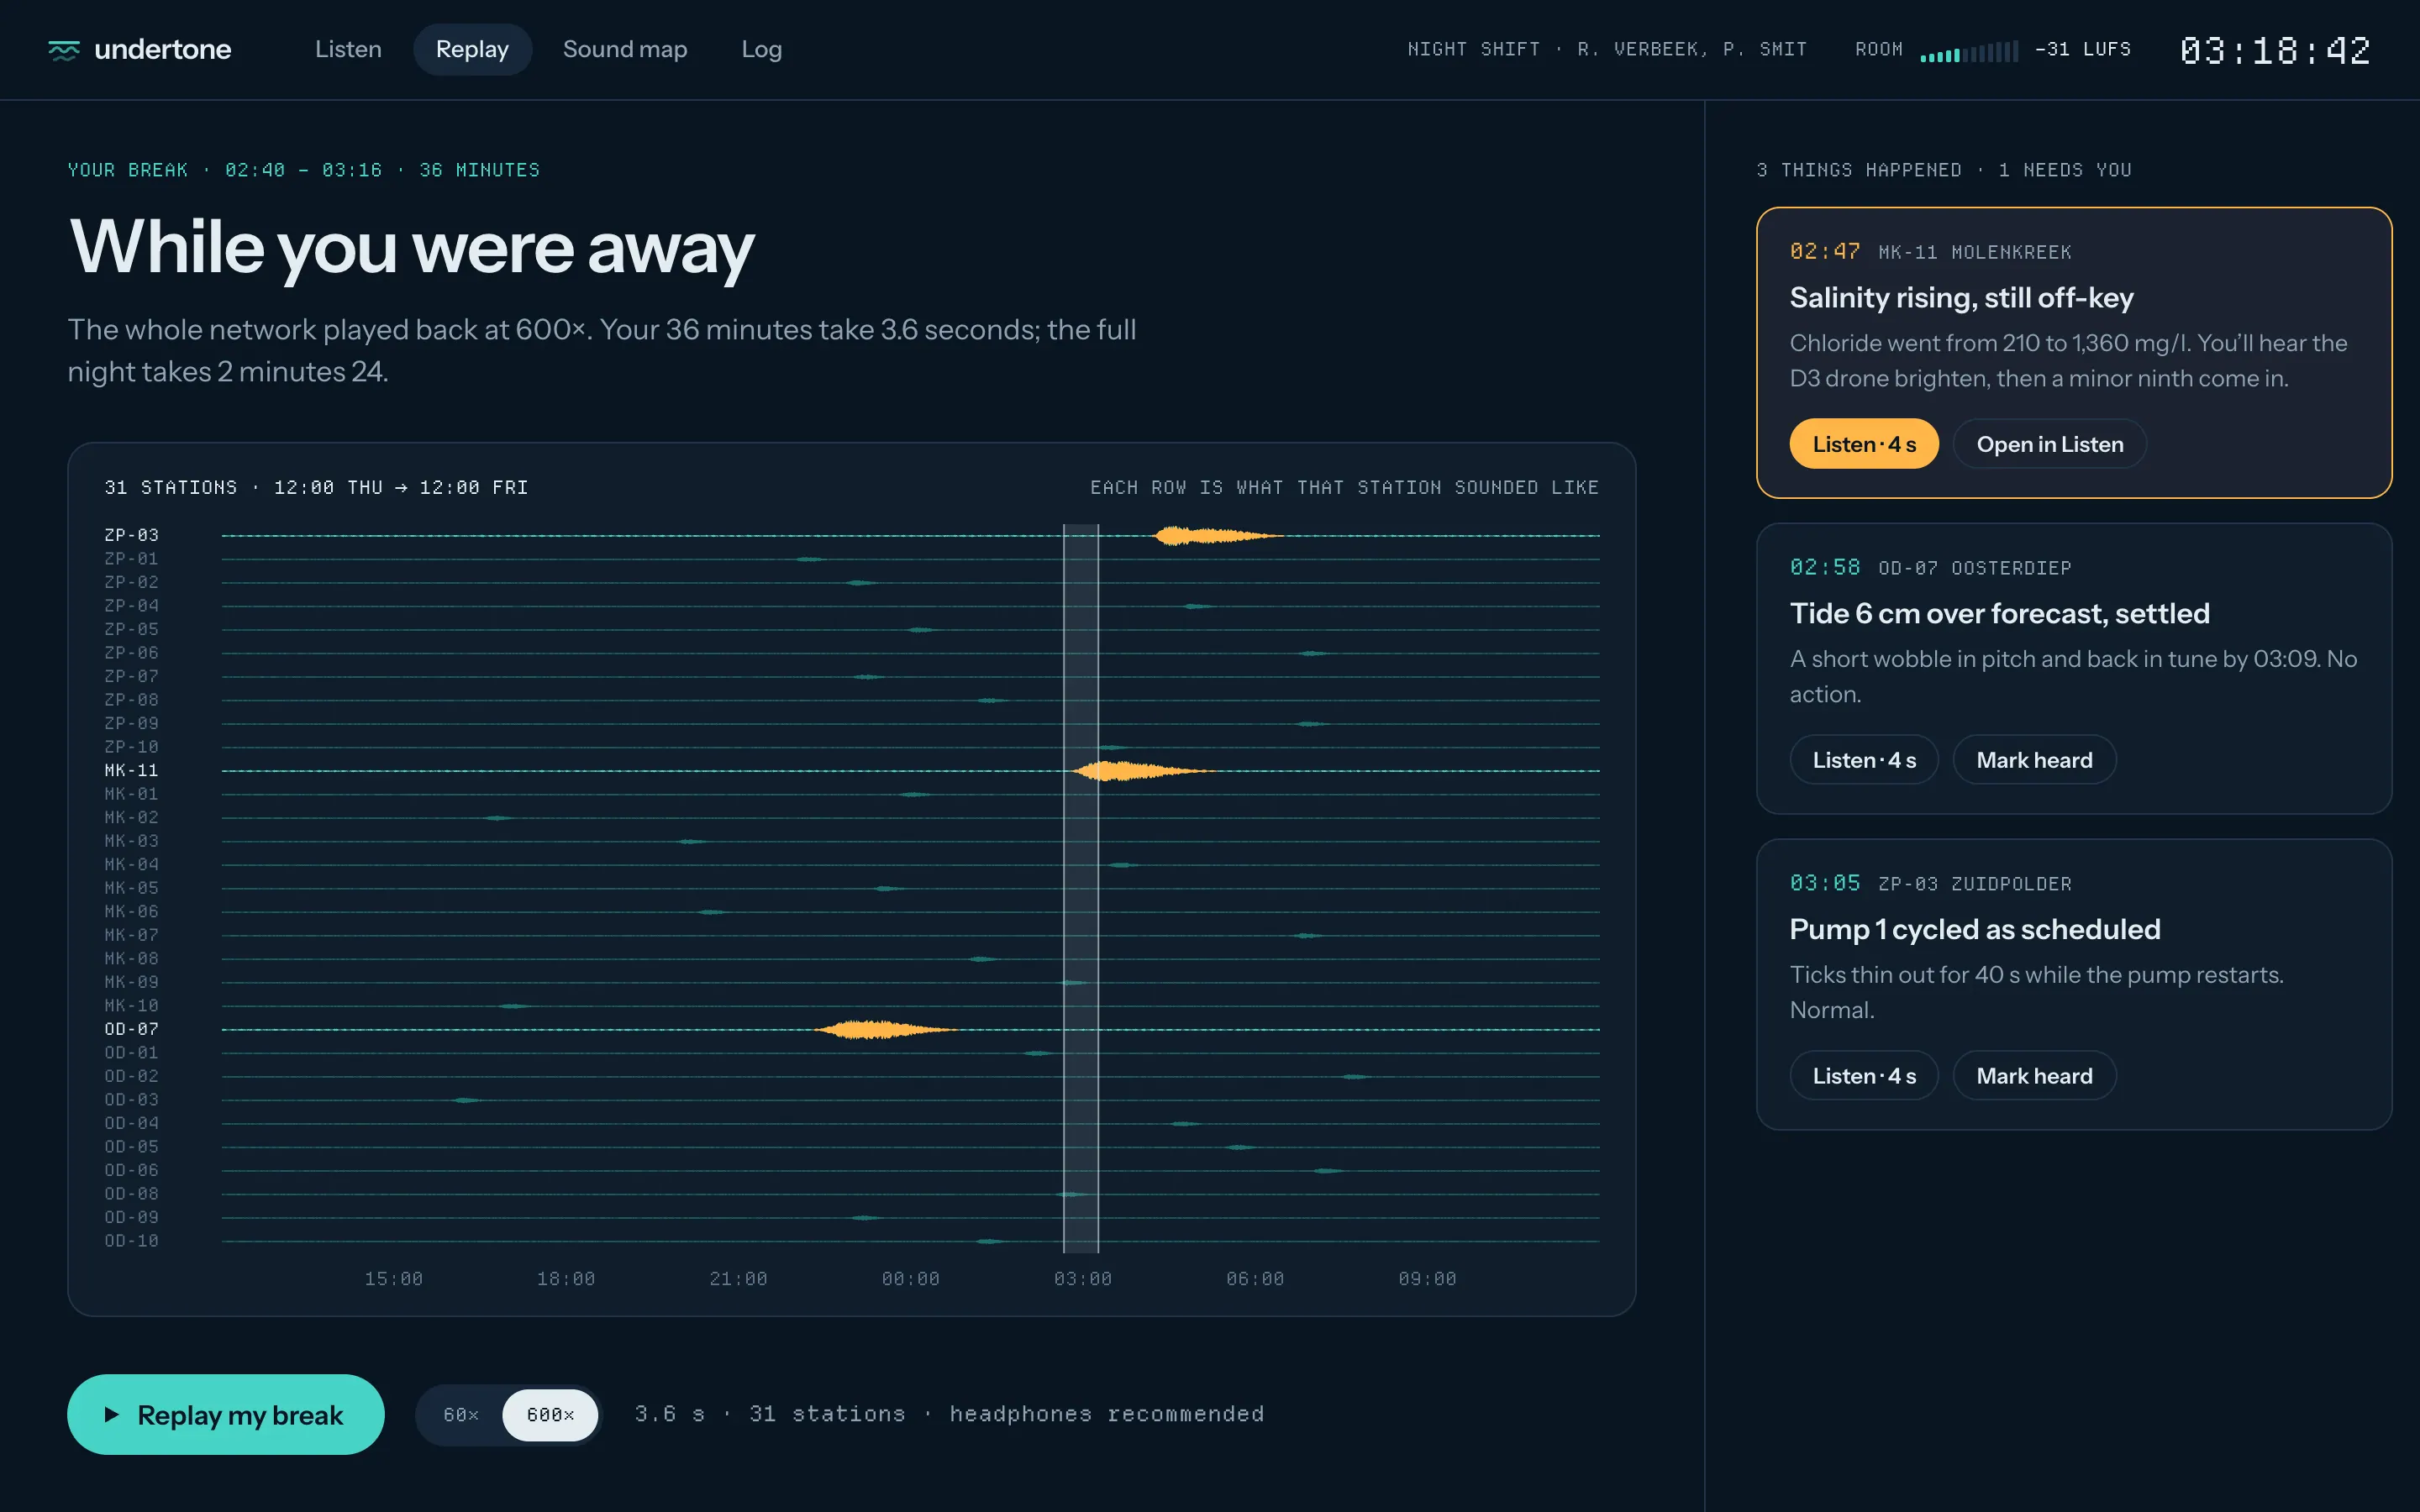
Breaks and handovers are when things get missed. Replay plays the whole network at 600×, so a 36-minute break takes 3.6 seconds and a full night takes 2 minutes 24. Every event in the break summary has its own four-second clip.
- 04
A visual twin for every sound
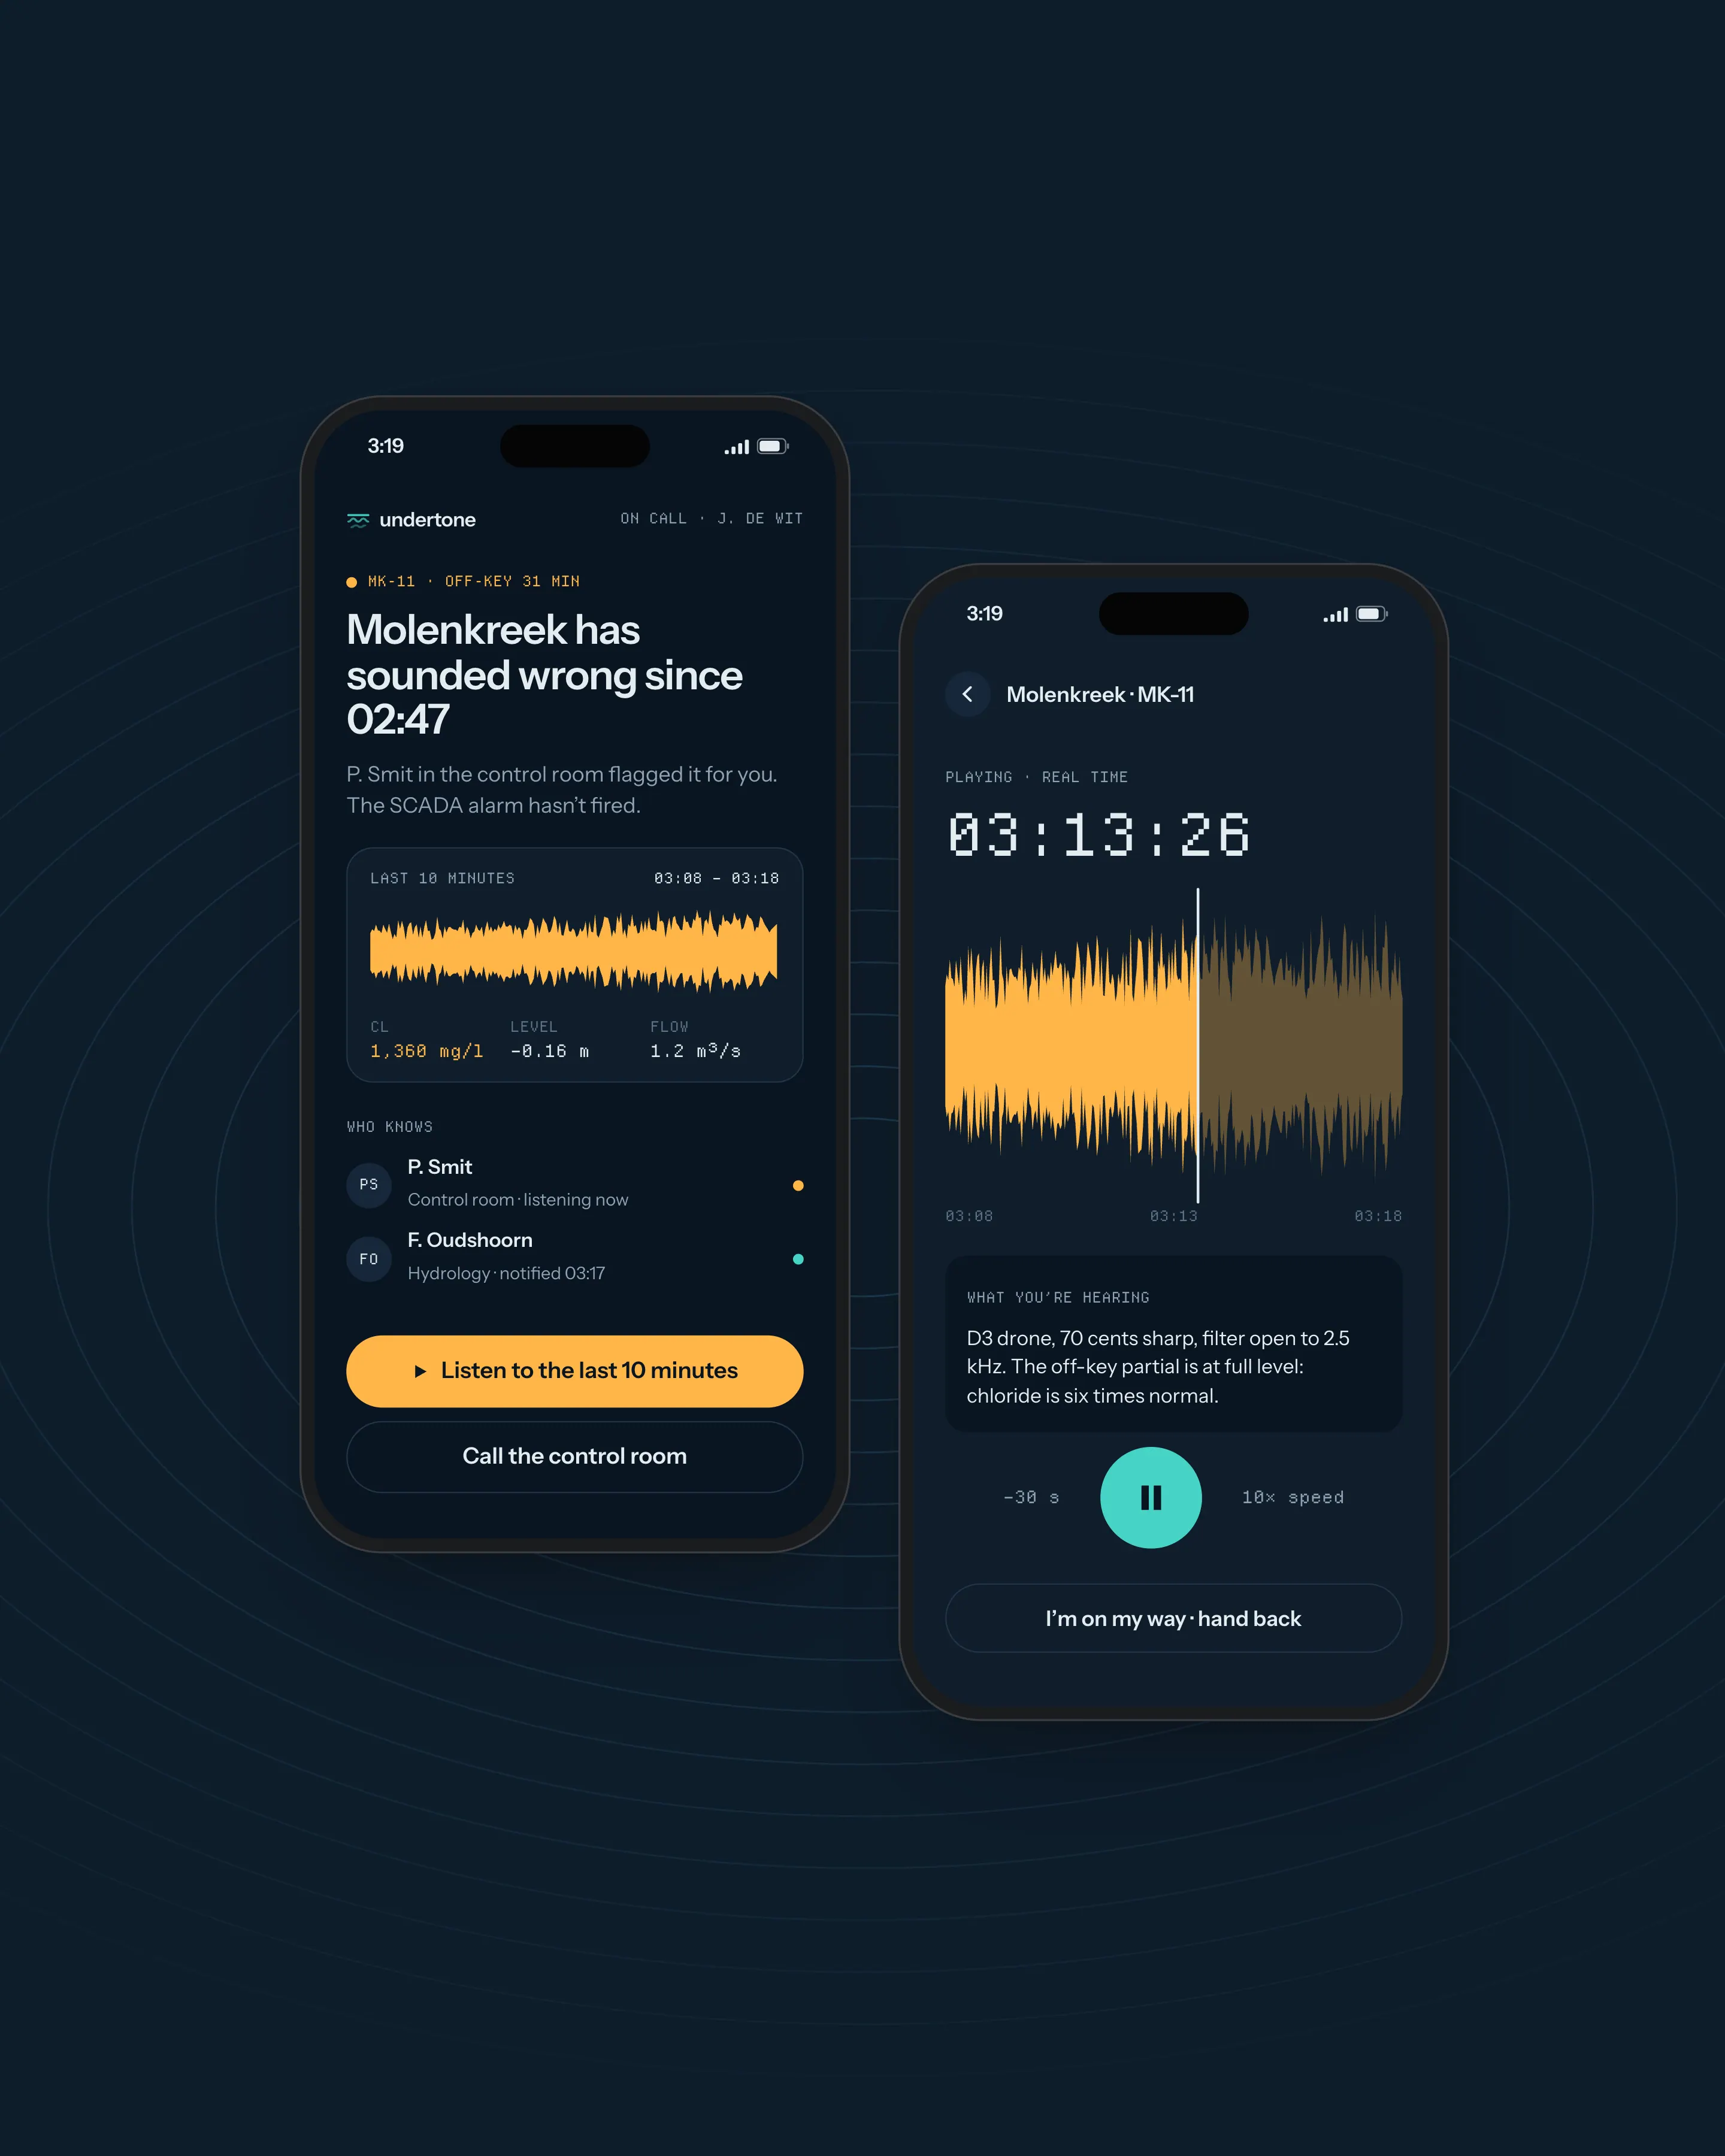
The waveform lanes show exactly what is playing: the band swells and turns amber when a station goes off-key, and the readouts name the note, the cents and the filter. Sound is never the only way to find out, and an operator with headphones off loses nothing.
Outcome
We ran a ten-week pilot from January to March 2024. Femke’s team injected eleven anomalies into live data without telling the night shift. Operators flagged nine of them by ear before the threshold alarm fired, with a median lead of four minutes. The two misses were masked by gate maintenance and a long radio call.
Nobody complained about the sound in seventy nights. The night shift asked to keep it running when the pilot ended, and Undertone now covers two more pumping stations alongside the first three.
Live demo
Play the night of 14 March
Try it
Designing a sound nobody hears
The hardest part was making the normal state boring. Early versions gave each station a short melodic motif. Operators found them charming for one night and exhausting by the third. Drones won because they disappear: after twenty minutes you stop hearing them, and the first beat of an out-of-tune interval brings them straight back.
Jules Amrani and I tuned the mapping on recordings of real nights rather than synthetic data, so the ranges follow how these stations actually move. Any change to a sound map can be auditioned against a stored night before it goes live.
“I used to scroll back through the trends after every break and still feel like I’d missed something. Now I listen to my break on the way back to the desk, and if something’s off I know before I sit down.”
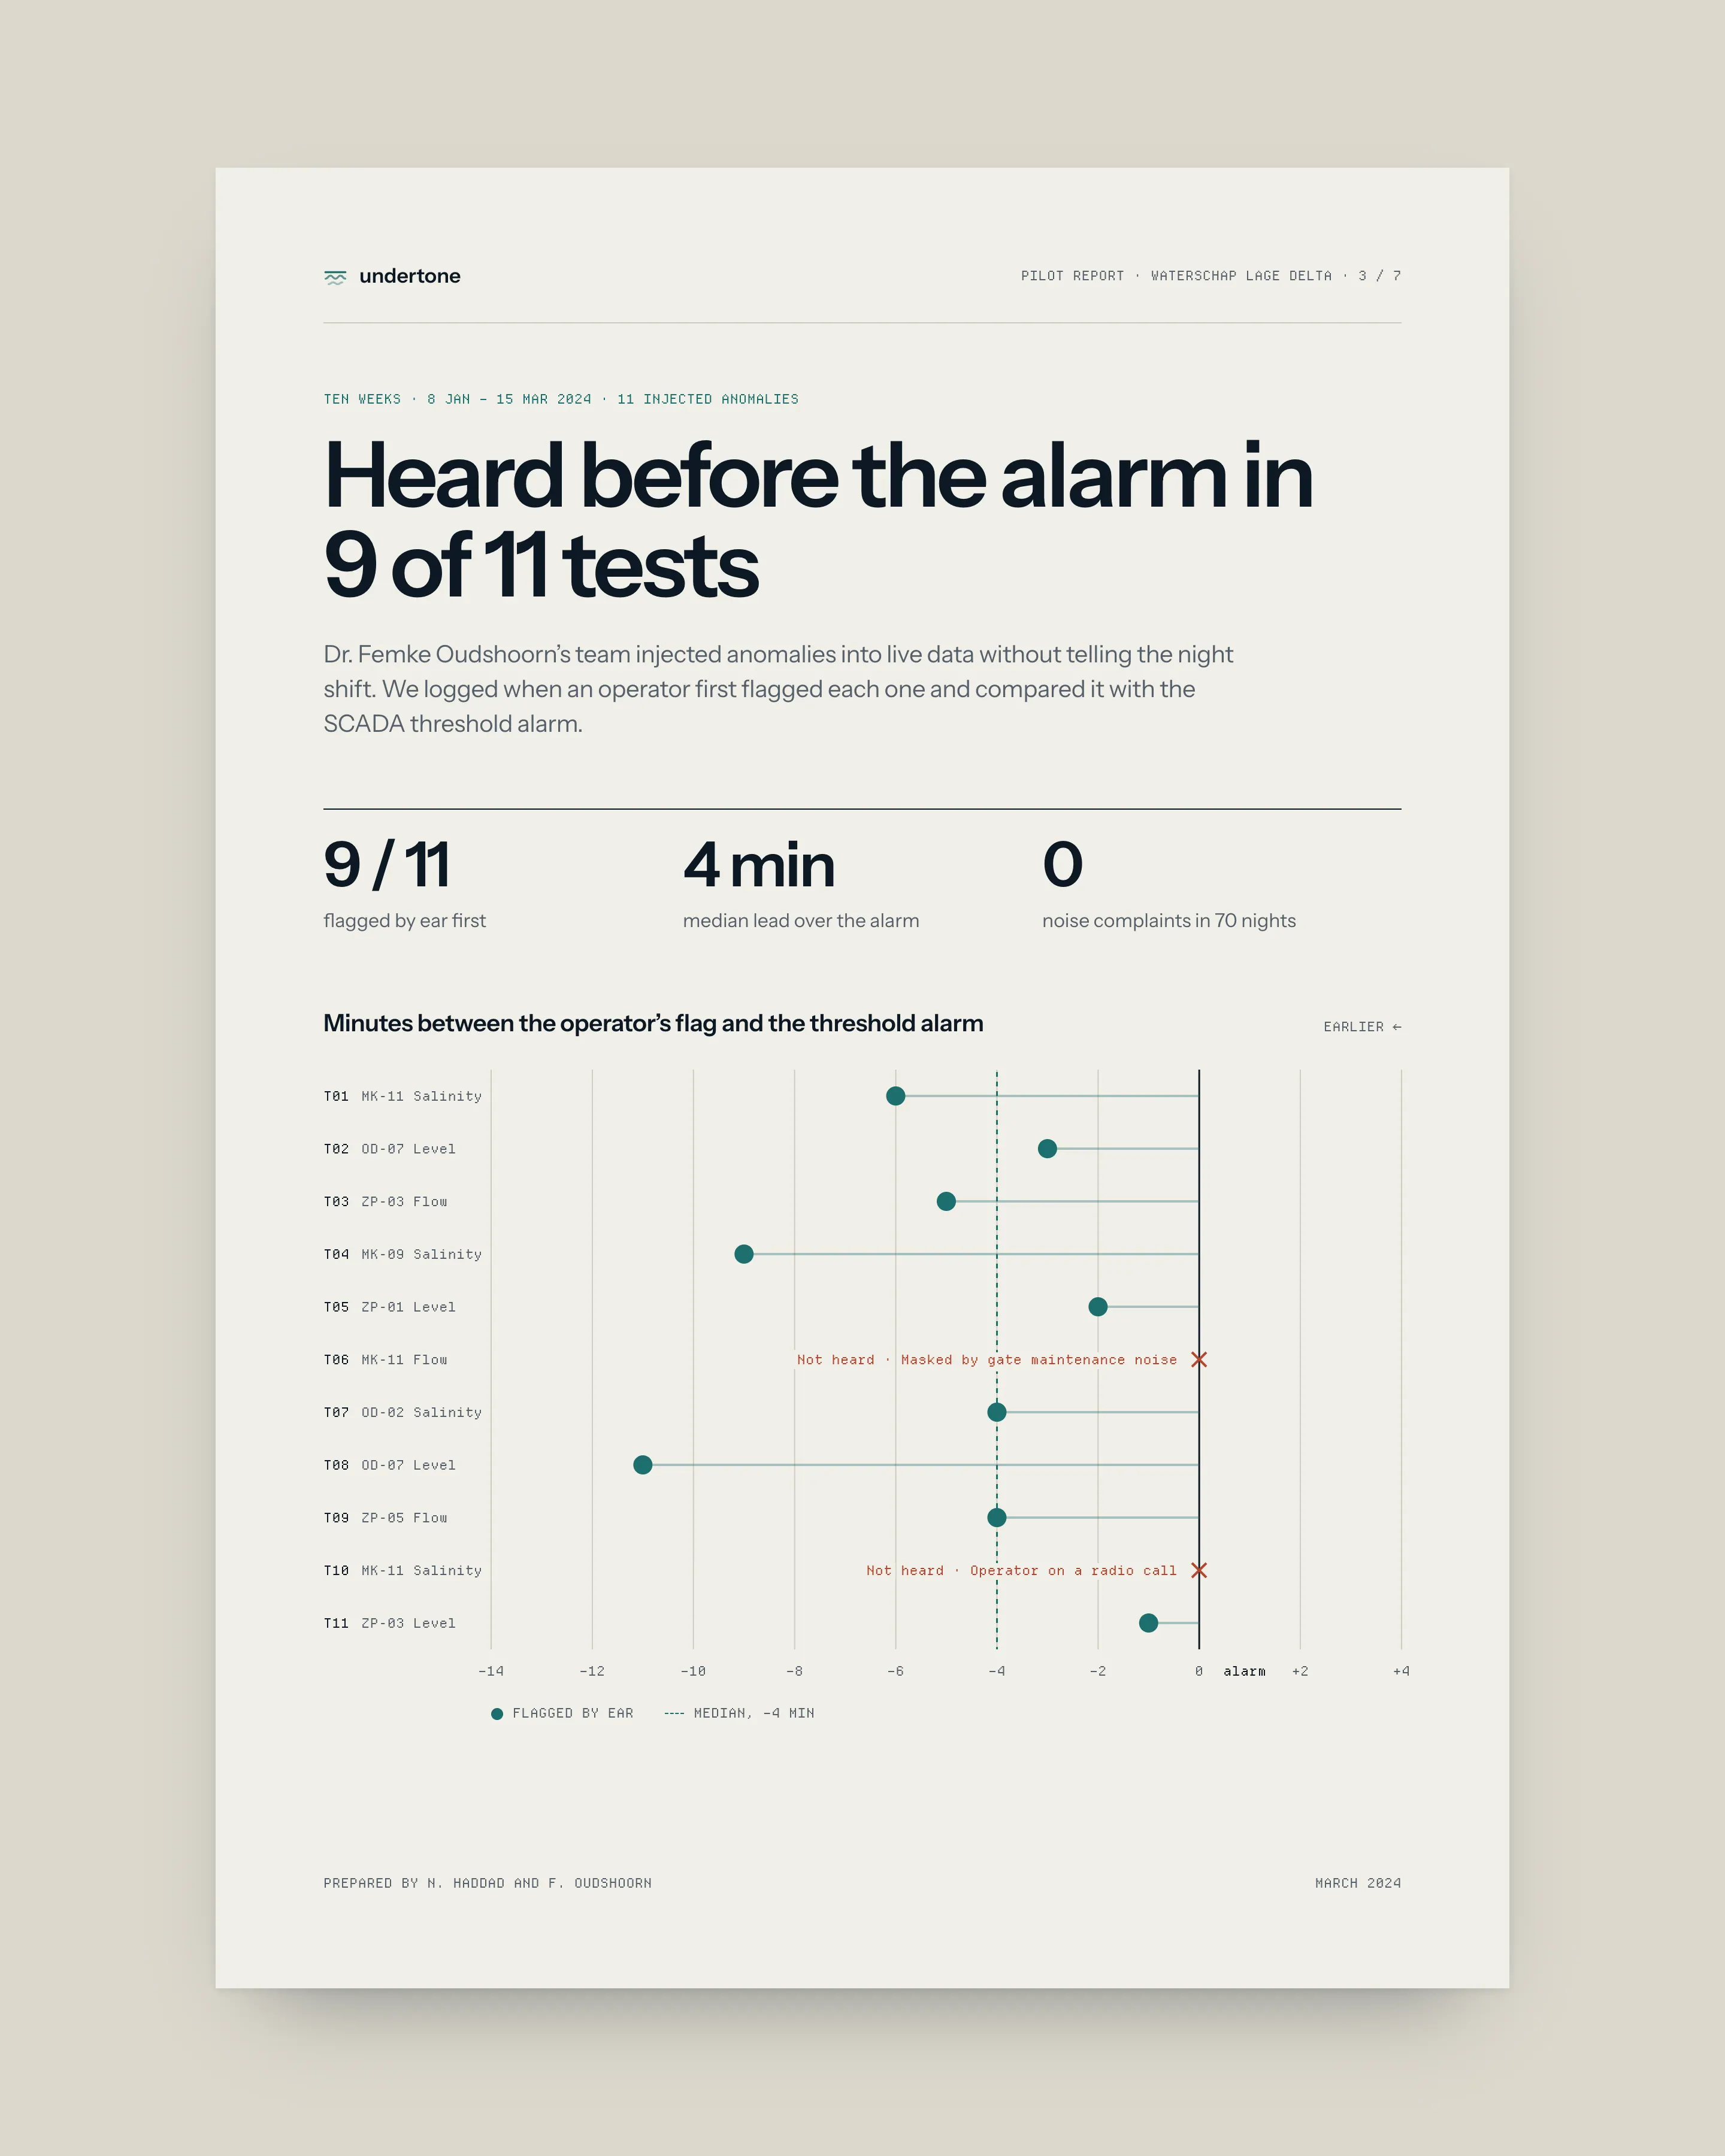
- injected anomalies flagged by ear before the alarm
- 9 / 11
- median lead over the threshold alarm
- 4 min
- replay speed: a full night in 2 min 24 s
- 600×
- noise complaints in seventy nights
- 0